After some months of nothing but backend development I started to work on my customers Angular frontend application again. I noticed that starting a single karma test took way longer than it used to be. A simple test for a pure function in headless chrome took about half a minute, in which the actual test only took some milliseconds. That was really annoying, because in my current refactoring task I have to execute lots of tests very often. Searching, browsing the karma issues and so on didn’t help, so I want to describe, how I found out what has been causing the problems.
1. Find out where the time is spend
At first it is necessary to figure out, where the time is spend. Fortunately node has a really good built in profiler. Their simple profiling guide is quite good and describes how to find out the problematic calls. I won’t repeat its content here but assume that you read it or are familiar with profiling.
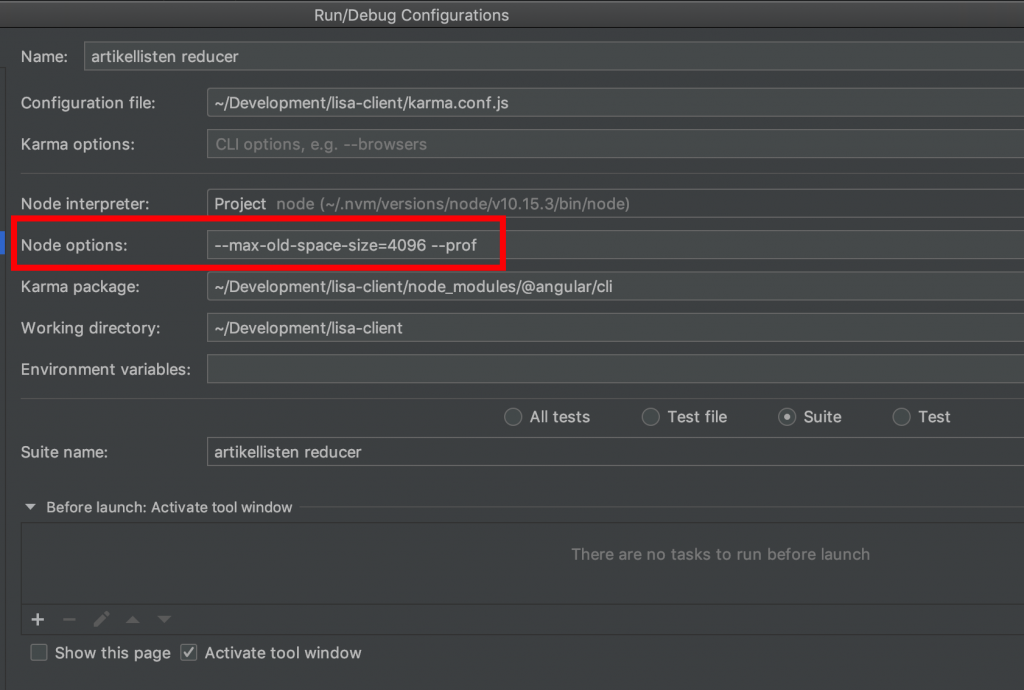
So I followed their guide and added the --profflag to the node options (in intellij this option can be added in the run configuration):
If you are using the command line, you could add it there too:
node --prof ./node_modules/@angular/cli/bin/ng test ...
After execution of the test a isolate-<some integer>-v8.log file is created in the project folder. This can be feed into node to create a report from it:
❯ node --prof-process ./isolate-0x10264e000-v8.log
...
[Bottom up (heavy) profile]:
...
ticks parent name
1327 44.1% T _fcntl$NOCANCEL

728 24.2% T v8::internal::IncrementalMarking::Step(unsigned long,
v8::internal::IncrementalMarking::CompletionAction, v8::internal::StepOrigin,
...
The simple profiling guide in the documentation gave me some tips how to interpret this output. But basically we see here that 44,1% of the time is spend in a C++ method called _fcntl$NOCANCEL.
2. What is the method doing?
Now we need to find out what this heavy load method is doing. Fortunately, this is a very specific search term, so using Google I found a stack overflow answer which said that _fcntl$NOCANCEL is related to file system operations.
3. Why is the method being called so often?
Such a simple test shouldn’t lead to lots of file system operations. Now we need to find out which files are accessed so heavily. Unfortunately the karma logging isn’t really helpful and we don’t know if we can trust it. Fortunately for linux there exists strace and for mac os (which I’m using) there exist dtrace and dtruss. Basically these programs just show you the system calls your program executes and their parameters. Hereby you don’t have to rely on the logging of the program but you can see what is really going on. This is not a strace or dtrace guide, but there exist a lot of how to guides out there (like this one for dtrace / dtruss for mac os).
There are two dtruss options which we will be using:
-f <command>When this option is provided, dtruss follows child processes. We’ll use this option to start the node process. Even when the node process starts child processes, we’ll see the system calls they execute.-t <syscall>We know that file system operations slow down the test execution. If we would log all system calls our process is executing, we would probably see nothing. So we’ll use this flag to only examine the problematic fileopen_nocancelsystem call.
To only execute the single test, we annotate it with fdescribe. Afterwards we start the test via dtruss like this and see at lot of accesses to scss files (we even see which are accessed):
❯ sudo dtruss -t open_nocancel -f node ./node_modules/@angular/cli/bin/ng test lisa
# ...
82846/0x11de5b: open_nocancel(".../generated_material_theme.scss\0", 0x0, 0x1B6) = 29 0
# ....
Other than that, only the test files are accessed. So our stylesheet scss files seems to be the cause for the problem. That the tests even needs the scss Stylesheet files is unexpected, because our unit test just tests the code and the html template. So there ist no reason why the Saas scss files should be compiled.
4. Verification
Now we need to test, if the performance will be faster without these Saas scss files. Even though they aren’t needed by the tests they are referenced by the Angular components so we can’t simply delete them. The fastest way to verify our hypothesis that they are causing the problems is to overwrite them with empty files. This can be done by using the following bash command:
find . -iname "*.scss" -exec sh -c 'echo {}' \;
Now I compared the execution time of the tests:
- Before with the original scss
- Executing all tests via command line took 6min and 20 secs
- Executing a single test via Intellij took 20 secs
- With empty scss files
- Executing all tests via command line took 2min and 30 secs
- Executing a single test via Intellij took 6 secs
So it is three times faster. The single test execution in Intellij is acceptable now.
5. The quick fix
I already spent too much time on the issue. As a quick fix I wrote one function which just overwrites the scss files so that they are empty. And another one to restore the scss files, because I need them if I want to run the Angular application. I added these functions to my .zshrc (or .bashrc if you are using bash instead of zsh) so that I can execute them in my terminal:
function scss_empty {
  local scssFileName
  for scssFileName in `find . -iname "*.scss"`
  do
    local newFileName=${scssFileName//\.scss/.original_non_empty_scss}
    mv -v $scssFileName $newFileName
    echo > $scssFileName
  done
  echo "scss renamed. restore original files via scss_restore."
}

function scss_restore {
  local fileName
  for fileName in `find . -iname "*.original_non_empty_scss"`
  do
    local newFileName=${fileName//\.original_non_empty_scss/.scss}
    mv -v $fileName $newFileName
  done
  echo "scss restored. "
}
Before test driving my code, I execute the scss_emptyfunction to overwrite the scss files. Before committing or before starting the Angular application, I excecute the scss_restorefunction. Our build pipeline now always overwrites the scss files before executing the unit tests, which speeds up the build by several minutes.
There might exist other solutions. I found no easy one like just setting one option, but in one stackoverflow thread someone suggested to change the resolver for scss files to return only empty strings if tests are executed. But that we’ll try out in future in a dedicated task. The quick fix solves my immediate problem so that I can execute the tests fast enough and often.
6. Conclusion
Thanks to the tools provided by node and thanks to the good simple profiling guide, finding the culprit method is very easy. Thanks to strace for Linux or dtrace / dtruss for mac os is a very easy way to see what’s going on – even when the logging of the node program like karma is not sufficient. It’s nice that you can even see the parameters of the system calls so that, for example, it is obvious which files are accessed. Especially the strace or dtrace / dtruss tools are tools to have in you sleeve.